Turn your data into profitability insights

Data Visualization

UNVEIL TOTAL COST FOR COMPETITIVE PRICE ADVANTAGE & INCREASED PROFIT
The PlaidCloud Data Visualization solution provides data connectors for system and data source integration, an extensive collection of data analysis and enrichment tools, and the ability to easily create Apache Superset charts,

Trusted by Finance Teams at Leading Organizations

Data Visualization Software Built on Apache Superset — No BI Tool Required

PlaidCloud is one of the few data visualization software that combines a massively parallel data pipeline with a fully integrated Apache Superset environment in a single platform. Finance and operations teams do not need a separate BI tool, a dedicated data engineering team, or a complex ETL process to get to a live dashboard. PlaidCloud’s drag and drop dashboard builder lets analysts move from raw ERP data to a published chart or report in a single workflow — connecting, transforming, and visualizing in one place. Operational analytics dashboards update automatically when workflows complete, giving leadership real-time visibility into transfer pricing, profitability, intercompany activity, and supply chain performance.

Hyper-responsive Big Data Visualization

PlaidCloud is the only platform that brings together the power of GreenPlum and Apache Superset into a cohesive data analysis and data visualization experience.

Build End-to-End Visualization Pipelines

Build and deploy data pipelines that integrate, align, and enrich information using massively-parallel data pipeline technology.

Built-In Apache Superset Dashboards

Integrate Data Sources & Transform Large Datasets

Integrate Files, Data & Systems
Read from and write to any accessible data store. Integrate Files Data and Systems screen
PlaidCloud uses Greenplum technology to handle large data efficiently.Manage Large Data Sets
Extensive library of data extraction, transformation, and data visualization tools with point-and-click configuration.Build Simple to Complex Data Enrichment Workflows

Cost Allocation Dashboard Examples

Big Number, Bar, & Sankey Charts
Big Number, Bar, & Sankey Charts of multi-level cost allocations. Big Number, Bar, & Sankey Charts
Big number, pie, and map charts of intercompany invoices.

Inventory Dashboard Examples

Mixed Bar & Line Chart
Mixed bar and line chart of inventory forecast. Mixed Bar and Line Chart screen
Nested treemap of inventory analysis.

Shipping Dashboard Examples

Doughnut Chart
Analyze distribution across time blocks. Doughnut Chart
Track distribution and trends over time.

Key Benefits

Automated Interfaces

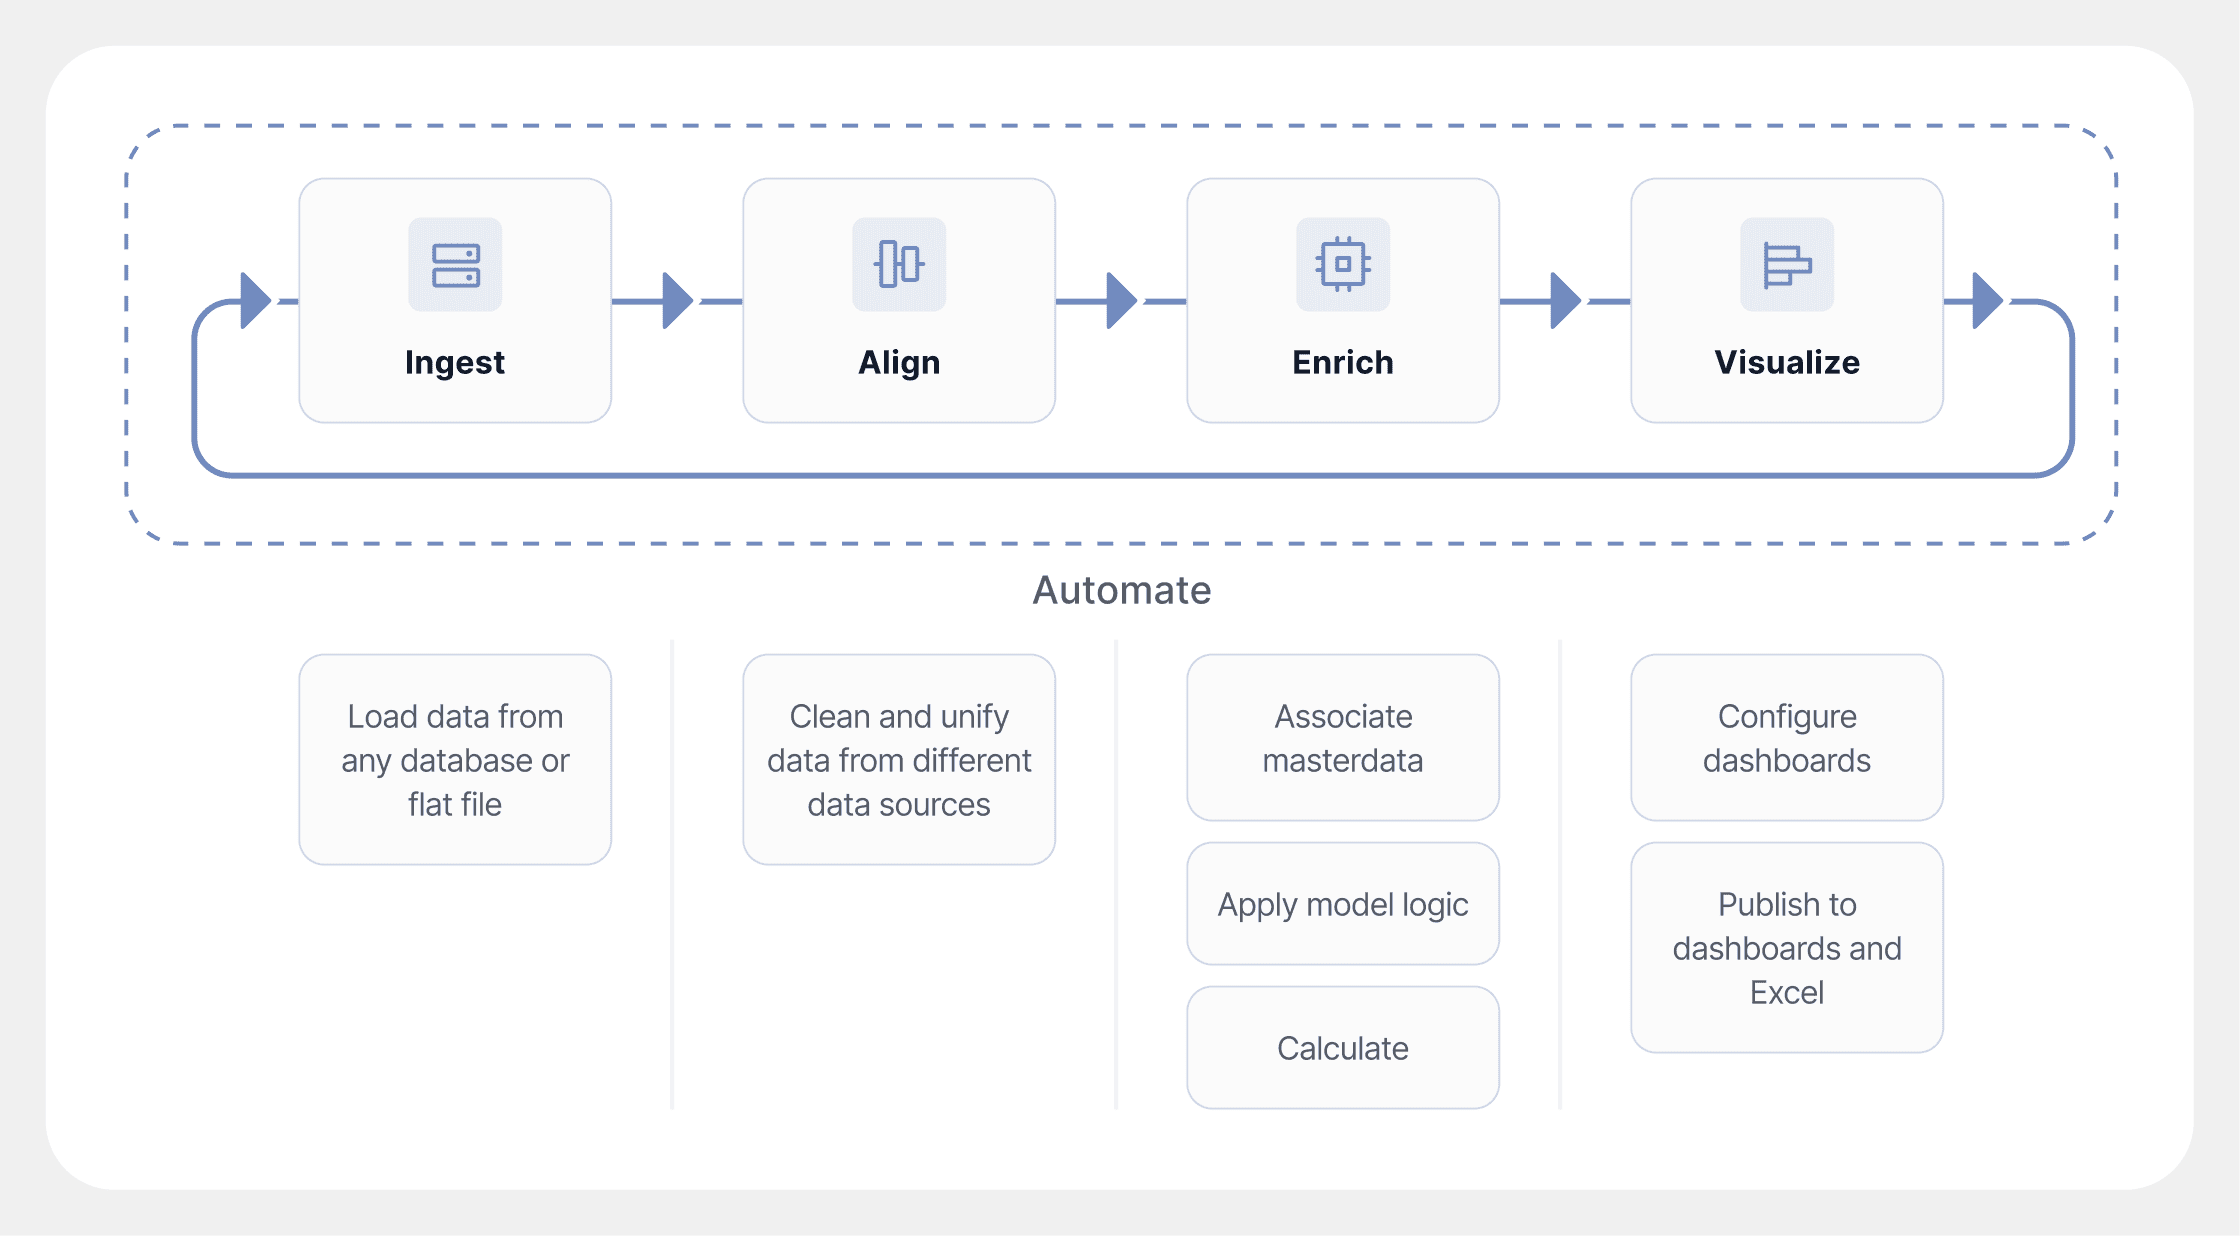
Automatically extract data from ERPs, databases, files, REST endpoints, and cloud services.

Large Data

Our customers routinely work with 50GB tables and multi-terabyte data sets.

Enhance

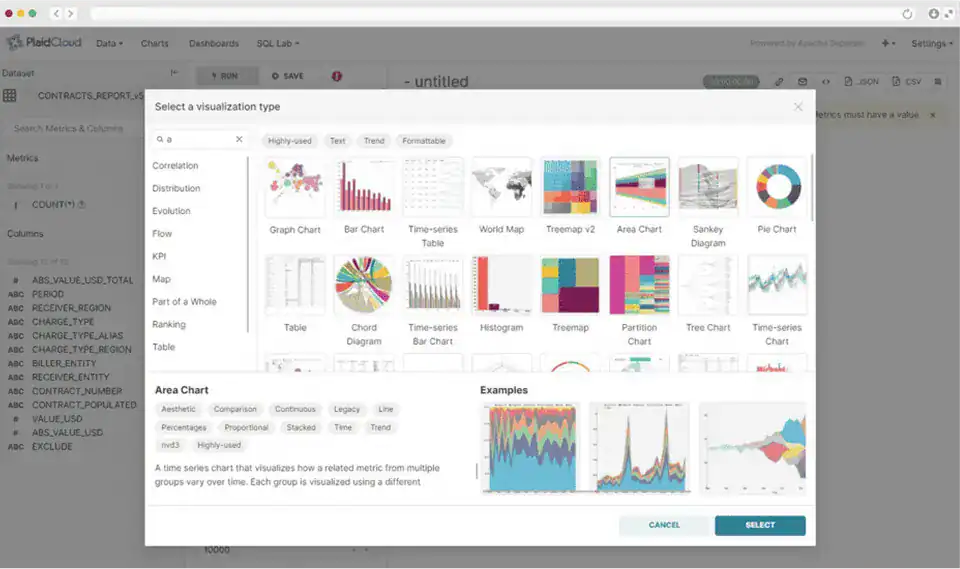
Build enhanced data sets with an extensive library of extraction, transformation, and analysis tools.

Data Visualization

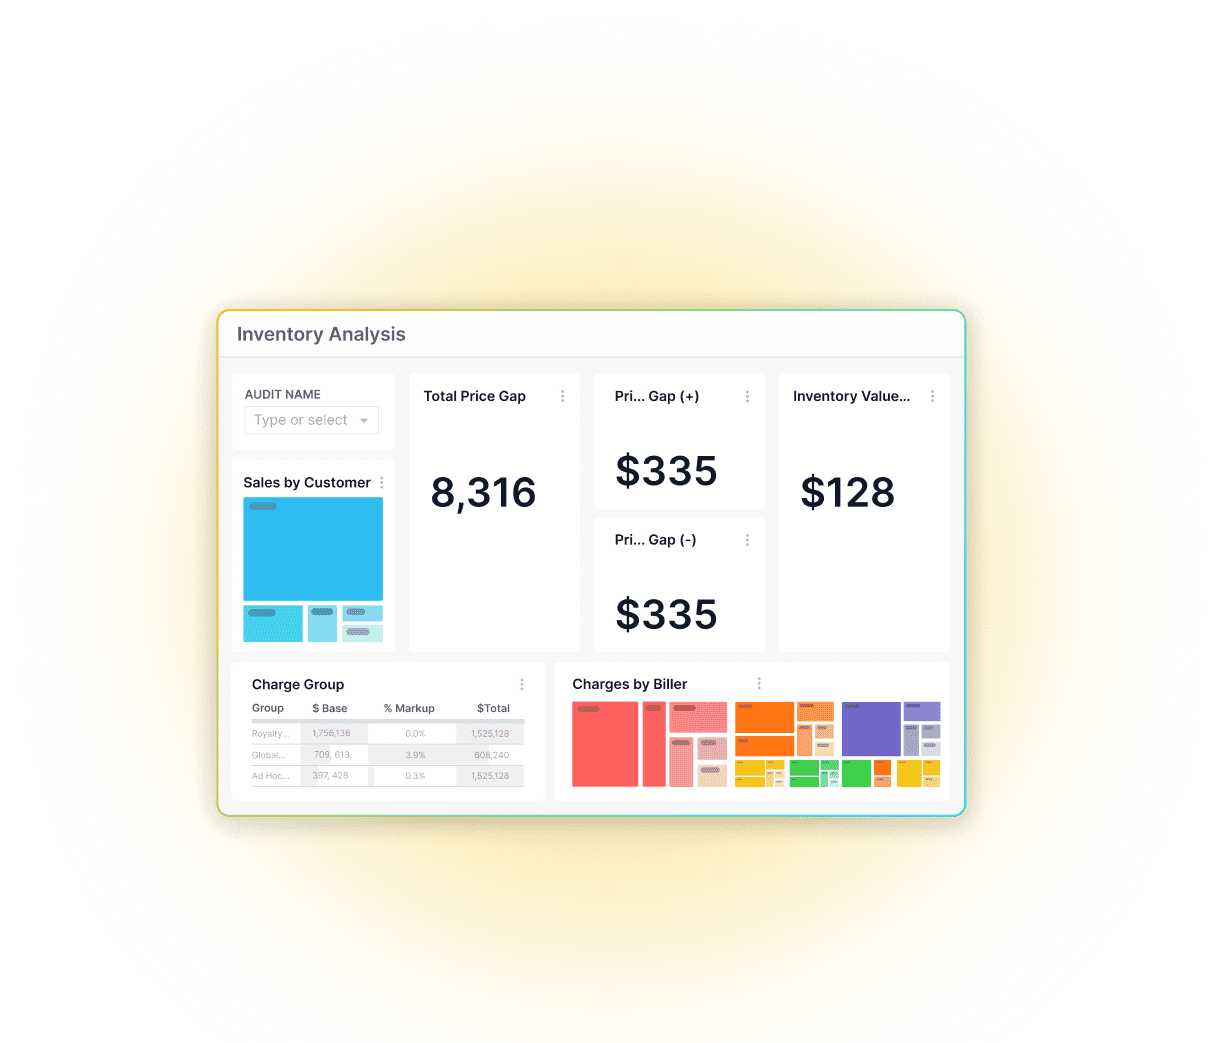
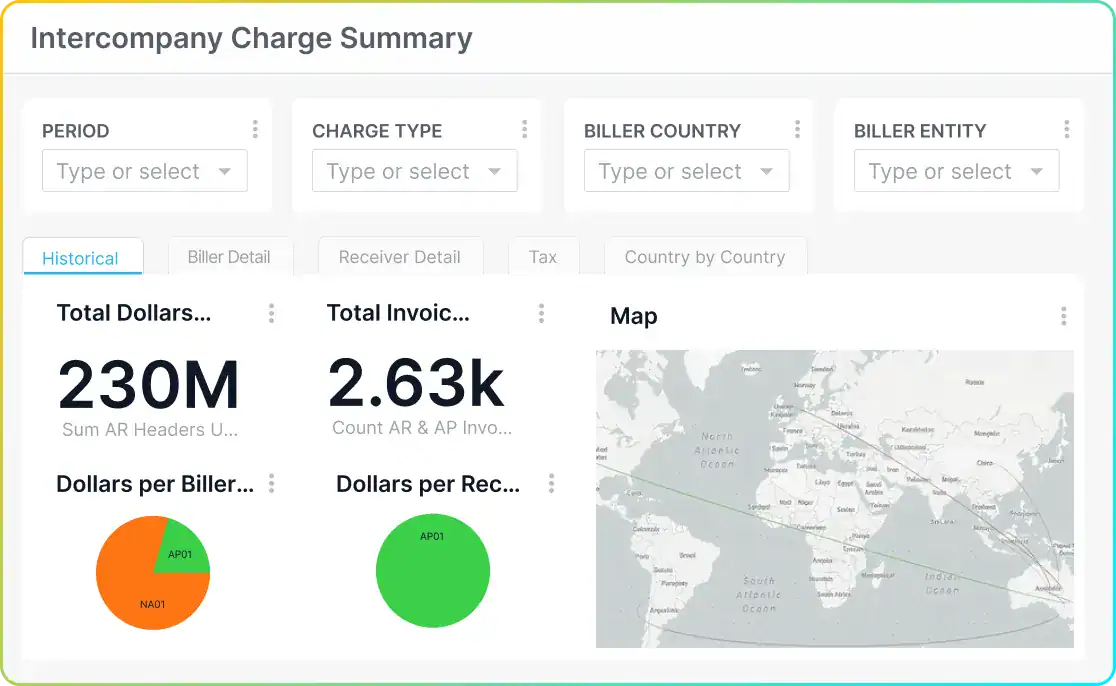
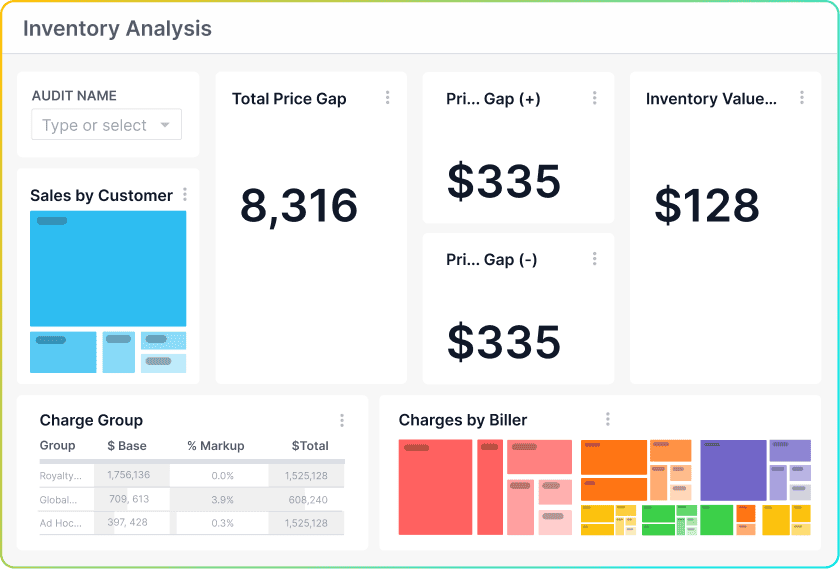
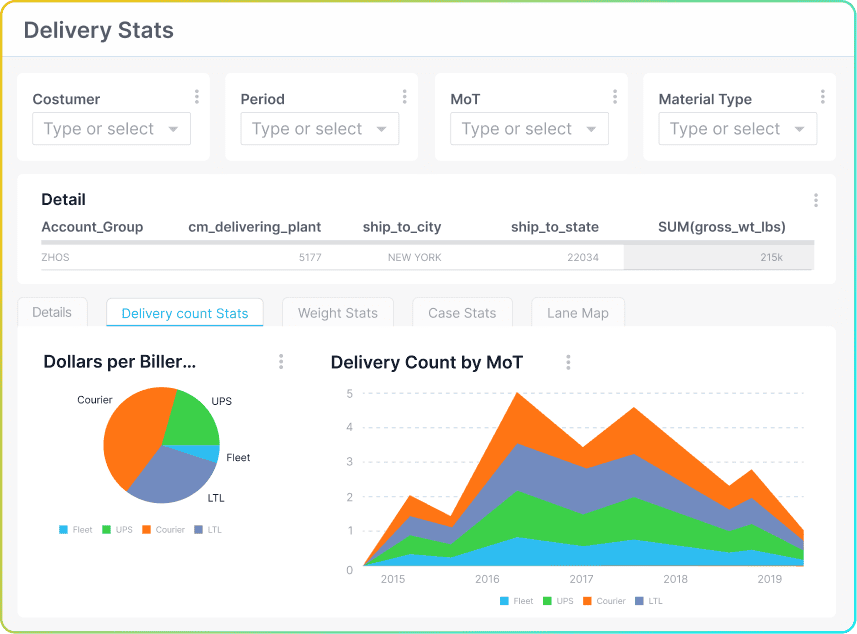
Integrated Apache Superset for high-performance dashboarding.

Real Time Data

Data is immediately available in dashboards when workflows complete. No additional movement or build process is required.

Enterprise Data Visualization Tools That Scale With Your Data

Unlike standalone enterprise data visualization tools that require external data preparation, PlaidCloud builds the pipeline and the dashboard in the same environment. Customers routinely run visualizations against 50GB tables and multi-terabyte datasets — with no performance degradation and no additional infrastructure to configure. Charts, treemaps, sankey diagrams, and geo maps are all built natively within Apache Superset and refresh automatically as underlying data changes. Every visualization is shareable, access-controlled, and connected to the same governed data model your finance team relies on for reporting and compliance.

GET IN TOUCH

Start With a Conversation

Turn your company’s financial and operational data into actionable insights with impact.
Contact PlaidCloud to get more information and request a demo:

Let's Chat.

PlaidCloud Cloud can improve your operational efficiency and returns.
Name